Today we’re discussing the third element of our 360 degree perspective. Alongside student and teaching staff feedback we have data from the organisational perspective. If you’re engaged in the Tracker pilot this year you will have answered questions about ten organisational factors when you confirmed your place on the project. We’ve been keeping this data quiet for a while, as we think it’s most useful viewed together with your findings from learners. But in case you have a bit of thinking space between launching you surveys and analysing your data, here are some highlights for you to chew over.
Testing the questions
Our main goal this year was to test out the questions themselves. We were delighted that you chose to answer most or all of them, as we only asked for a minimum of four responses. This 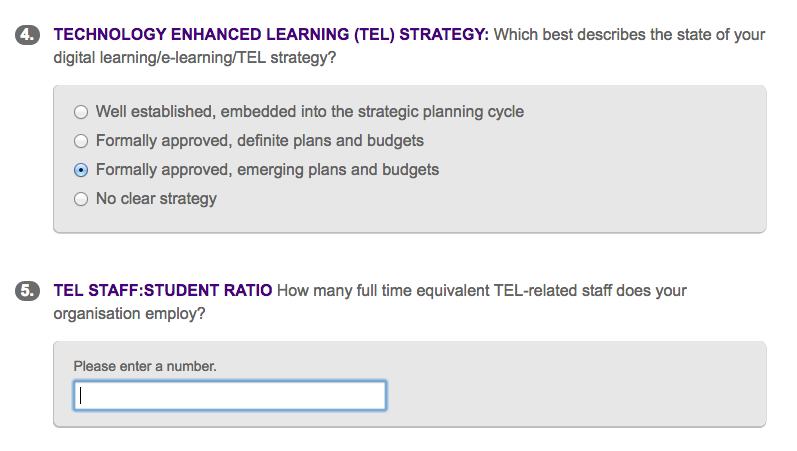 suggests that you found them interesting and potentially valuable, but not too difficult to answer. Having said that, most questions relied on self-assessment, and we had a second concern that responses would gather towards the more positive end of every scale. We were happy to find the full range of responses was used, even when the options were quite negative (e.g. ‘no clear strategy’).
Once we have some learner data to put alongside them we will test out how well each question performs in relation to key metrics. Meanwhile if you have comments on the questions or ideas for improvement please contact us, share your views on the tracker jiscmail list, or use the evaluation process to give us your feedback.
Who are our Tracker institutions?
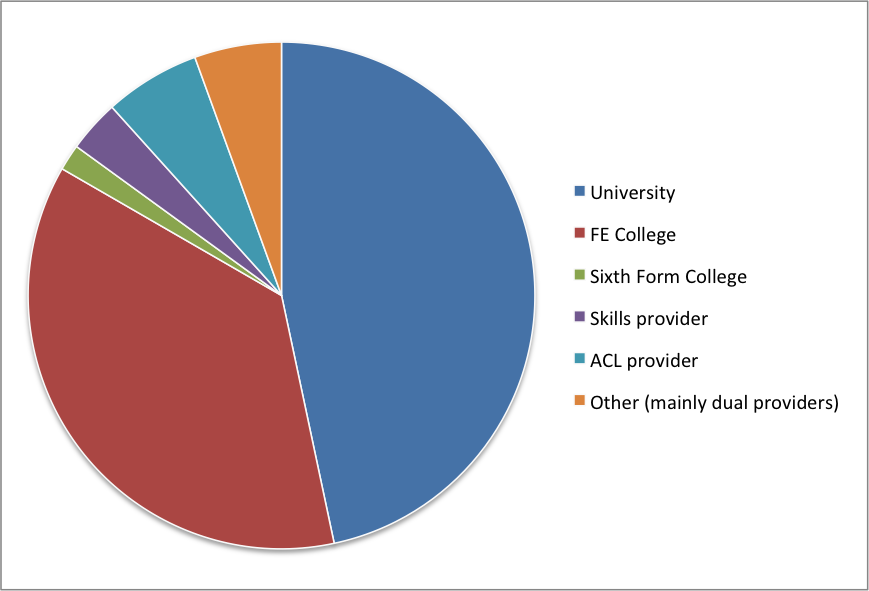
We had 180 responses in total: the breakdown of institution types (below) shows 84 Universities, 66 FE colleges, 11 ACL providers, and a mix of others including a fairly high number of dual providers. Taking dual providers into account, we were able to identify 93 Universities/HEIs (or dual providers) running the HE tracker, 68 FE Colleges (or dual) running the FE tracker, and 18 Skills (skills + adult and community) providers running the relevant trackers for their sector(s). These three groups form the basis of the charts that follow. Other groups were not large enough to analyse without risk of identifying individual organisations.
Eighteen non-UK universities are included in the HE group, enough to influence these results considerably. We are running a second analysis using only UK data, so please bear this in mind when looking at the charts.
Organisations varied hugely in scale, with student numbers ranging from 400 to 175k in HE, 520 to over 55k in FE, and 172 to 16500 in the Adult, Community and Skills sector. This last group includes a particularly diverse set of providers. One thing we can say with certainty is that variation within each sector group is more significant than variation across them.
Strategic environment
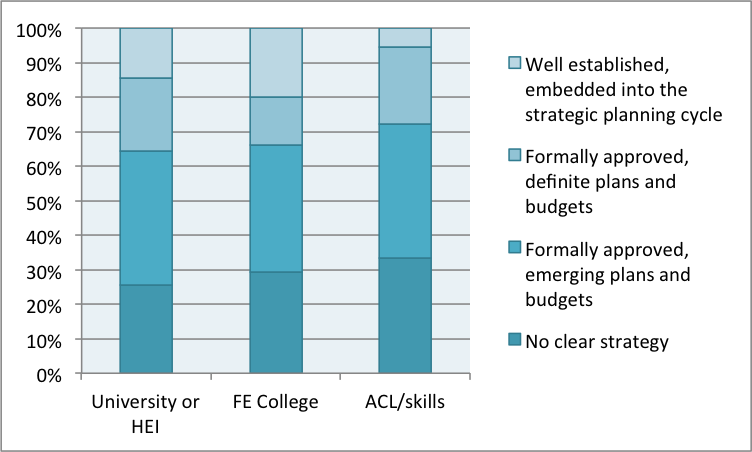
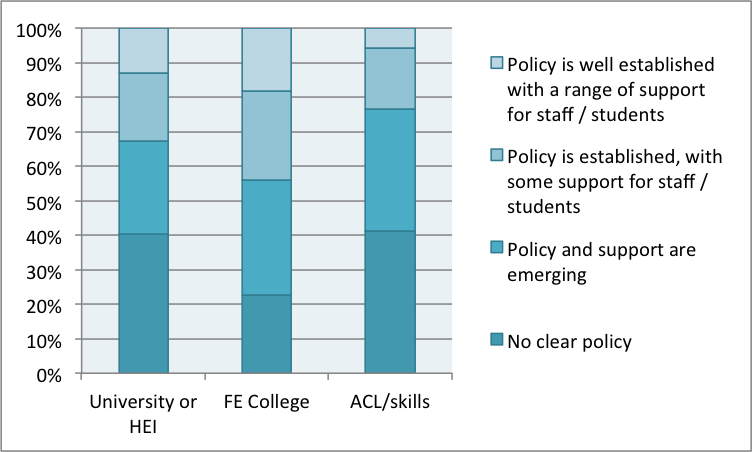
These two charts show the status of the current TEL strategy (or equivalent) and Bring Your Own Device policy (or equivalent) in the organisations that answered these questions. Only a handful did not, so responses are likely to be representative. On the face of it FE colleges seem marginally more confident about their BYOD policies – the mode response was ‘policy is emerging’ compared with ‘no clear policy’ in HE and ACL/skills. Given that tracker institutions have demonstrated that they care about the student digital experience, these low norms for strategy development are quite surprising.
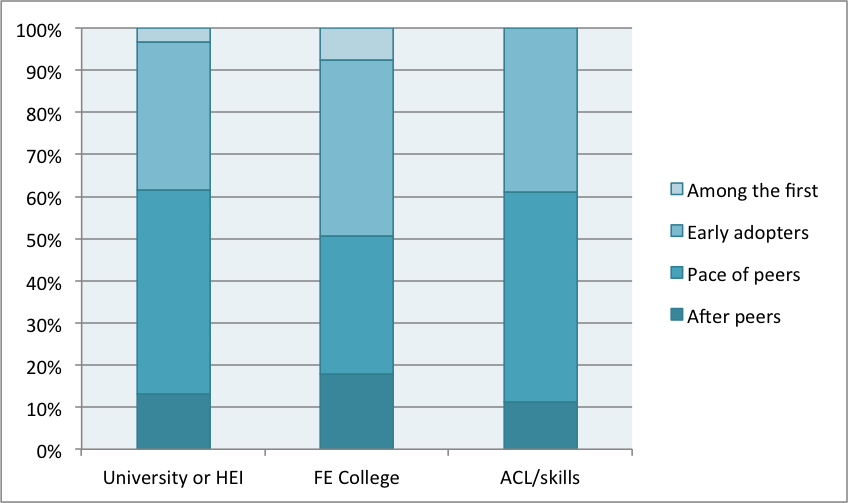
Respondents from the FE sector were slightly more likely to say that their organisation was an ‘early adopter‘ of new technologies (mode and median) than to say they adopted at the ‘pace of their peers‘ (the mode and median for the other sectors): again this has not been tested for significance.
Support for digital students
We used your responses to calculate the number of TEL support staff available per 1000 students (counting full and part time students as equally needing of support). The figures varied dramatically: it seemed that some respondents were counting their entire complement of teaching and student-facing staff as TEL support, which is an interesting position. There is a whole other blog post to be written about how you arrived at your numbers and definitions. Excluding these outliers, and the very large numbers who did not answer this question (do people actually know….?), the median comes in somewhere under 1 per 1000 across the sectors, but still with large variations that deserve further exploration.
We asked you about four different strategies for engaging students in their digital experience, and four different modes of student digital support. The different sectors had very different profiles of support, as shown in these charts.
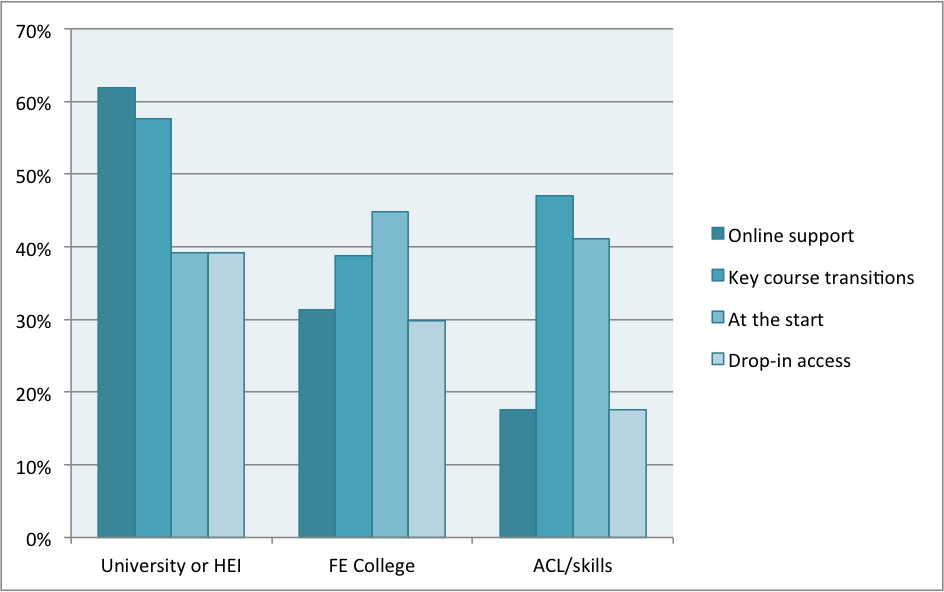

Universities were more likely to point students at online support than other sectors: they were also more likely to engage with course reps on digital issues. Looking at the volumes of these charts, universities appear to be delivering better on both student digital support and student engagement. Seventeen percent of HE respondents said they used all four means of engaging students, and 36% said they made all four means of digital support available (the corresponding figures for FE and ACL/skills were much lower). But these findings need to be tested and explored further, and of course we need to test the institutional perspective against what students say!
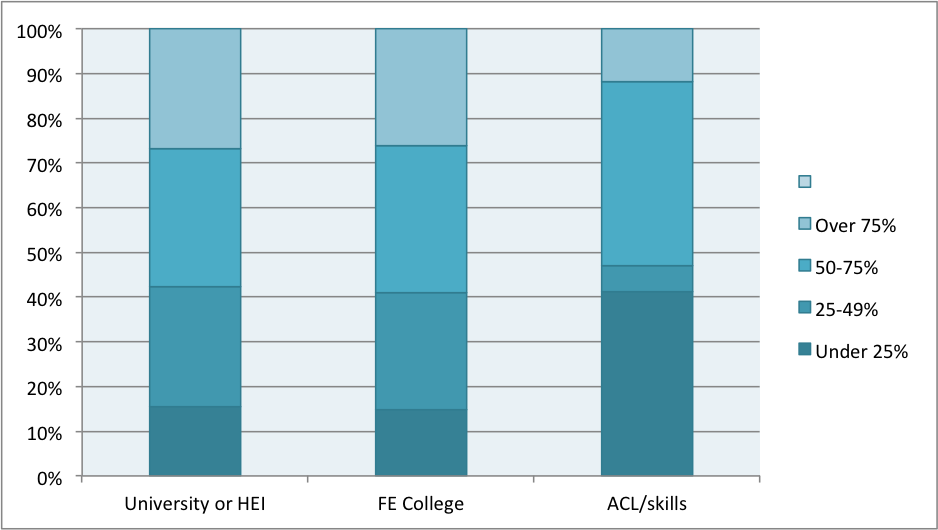
Reversing the trend, when it comes to the percentage of teaching staff who have undertaken TEL-related CPD in the last two years, the HE sector looks less committed to staff development than the other two. Only in ACL does the median come in above 50%, though this is on a small sample of providers.
The digital environment for learning
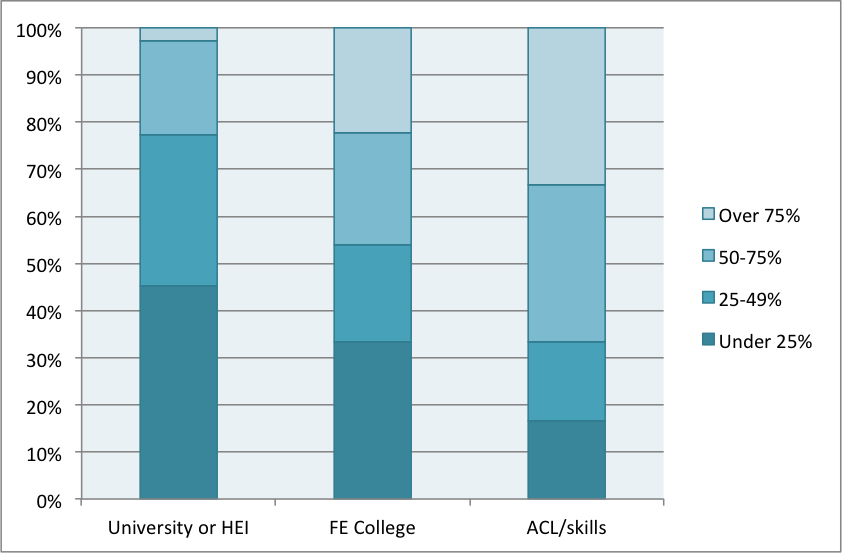
Finally we asked you to assess the effectiveness of your VLE/online learning environment, the standard of course-related software, and the digital readiness of learning spaces – three issues that directly affect the digital learning experience. All have corresponding questions in the staff and student tracker, allowing direct comparisons to be made.
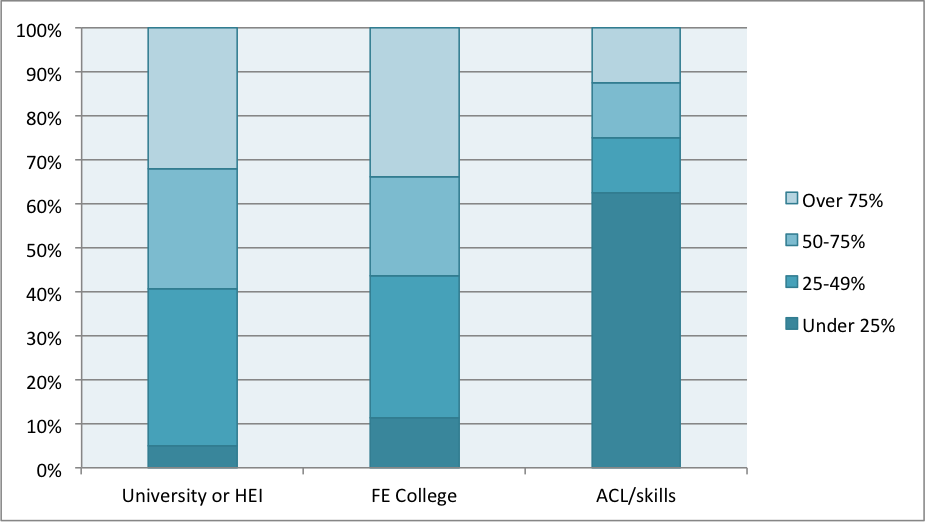

On all three issues, HE and FE responses are remarkably similar. Around 40% of organisational leads felt that (at least half of) their courses offered up-to-date software provision and effective use of the learning environment. At 60%, confidence in the status of learning spaces was higher. However, none of these results show confidence that the majority of learners are having a high quality digital experience. Responses from ACL were almost certainly skewed by the small, self-selecting sample.
As with other questions, it will be interesting to know how you assessed these issues. Who did you engage with? What existing data was valuable? How accurate do you think your own assessment will prove to be when measured against the perspectives of teaching staff and students? Please share any methods that were particularly effective or that led to interesting conversations and engagement that you might not otherwise have had.
With all the issues raised by this very interesting exercise, please comment on this blog post or on our closed email list!