If you are one of our 24 pilot institutions for the Tracker you’ll know that all surveys closed on 29th April. Well done to everyone for getting learners involved right up until the last minute. We had a total of nearly 11,000 completed surveys – an enviable set of data, giving us a really comprehensive snapshot of the digital learning experience across HE, FE and skills.
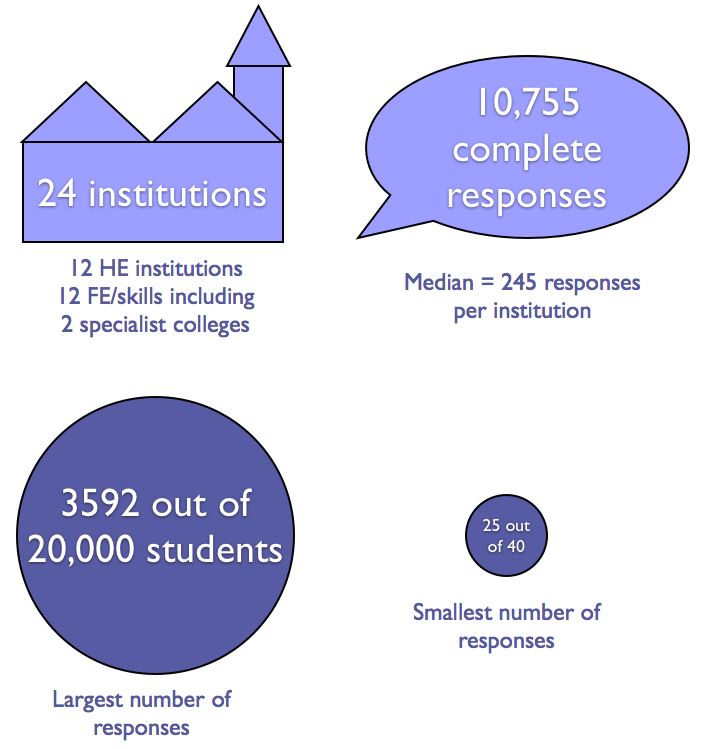 The maximum number of responses from one institution was 3,592 (from a University with about 20,000 students); the minimum was 25 (from a Specialist College with about 40 students)
There was considerable variation among our pilot sites in terms of their reasons for getting involved and how they engaged their learners. We’ll be writing up some of their experiences as case studies to explore these issues in more detail and to support future users if the Tracker becomes a full service. We are also asking all our pilot providers to complete a detailed survey that will help us improve both the Tracker itself and the implementation process.
All our pilot sites went through the same process, available from the Guidance page of this web site as a walk-through with links to detailed guidance at each step. We wanted to pilot the Tracker in a way that would be scalable as a full service, so our guidance materials and FAQs had to take the place of email or telephone support. Once they had received their unique survey URL, users themselves undertook the editing and release of the survey, student engagement, analysis of the data and planning responses to the findings.
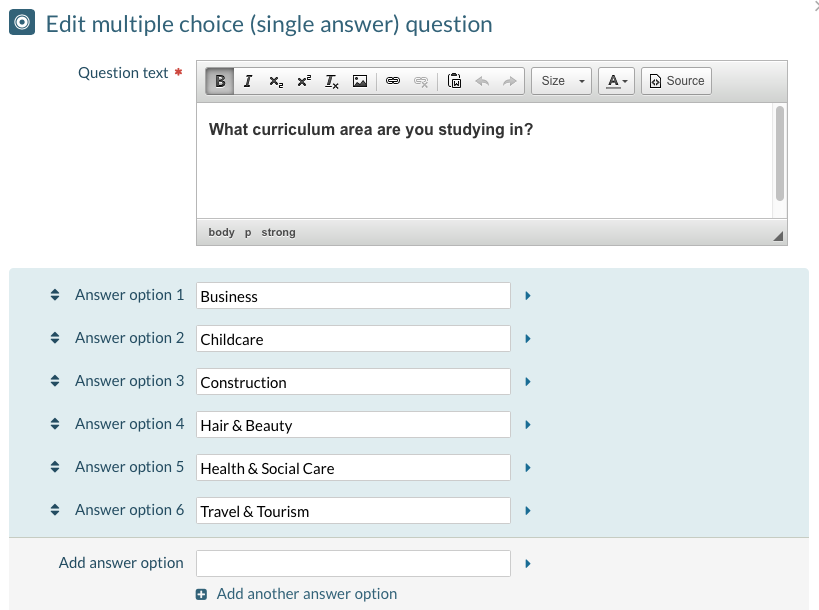
The Tracker is customised to allow each provider to focus on specific student cohorts, or to compare different groups e.g. by subject area or stage of study.
 Because some questions are customised, and because some invite free text responses, not all questions lend themselves to comparison between institutions. For those that do we have provided benchmark data for the relevant sector (HE or FE/skills). This means that pilot sites can directly compare their students’ responses with the mean for other, broadly comparable sites.
A total of 11 of our 24 institutions (46%) collected over 300 responses, and 19 (79%) collected at least 100 responses. For survey data to act as a valid, reliable representation of the student population you need to be 95% sure that the sample score represents the score from the overall population – plus or minus 5%. Initial analysis confirms that at least half of the institutions involved have collected enough responses to meet this rigorous standard. All are currently examining their data and planning how best to respond – including of course how to investigate further those issues that stand out.
So what do the responses tell us? We are still analysing the detail, including thousands of free text responses, and we are supporting institutions to make their own sense of local findings. We will share some headlines shortly.