Feedback on Tabetha’s powerpoint template and excel file has been overwhelmingly positive – thank you everyone who has got back to us to say how useful these have been. You can download both files from our previous blog post. (The excel spreadsheet now has
a minor update to improve the formulae – the links remain the same .)
.)
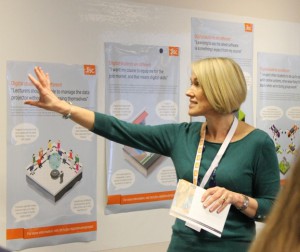
As we’re obviously onto a winner with resources to support reporting, Tabetha has also designed two posters you can customise for reporting your key messages around your university or college. You can download the posters as one customisable .pdf file here.
We also want to offer you another resource in draft, and discuss the possibility of a further toolkit – still at the concept stage. We’d like your feedback on both of these.
Digital student experience benchmarking tool
This DRAFT benchmarking tool enables students to audit their own digital experience. This was first developed by Helen back in 2015 with the support of the NUS, student change agents, and the Student Engagement Partnership (you can download the original here). It has been used by student unions and guilds to initiate conversations about their digital experience.

However, the existing tool really needed an update to reflect what we have learned in piloting the tracker, and to tie in more closely with the questions we are asking. We’re working with student organisations to refine this new version and make sure it meets their needs. We’d also like to ask our tracker pilot institutions for feedback. Is this a useful resource? How might it be used in practice?

Some ideas we have are:
- Student focus groups could identify the areas where they want to see progress: these can now easily be mapped to findings from the tracker survey.
- Students could work from this resource to produce their own ‘blueprint’ for what they’d like to see happen, whether or not the tracker survey is run.
- Students and staff working together on the benchmark might decide they need to run the student tracker, to canvas student views more widely.
- Tracker leads can map findings from the student survey onto this tool to see what ‘next steps’ could be planned: these could be communicated with students in feeding back the tracker findings (e.g. in a ‘you said, we did’ style).
Digital toolkit
For some time we’ve been wondering how Jisc could support organisations to build a ‘digital toolkit’ for arriving students. Organisations are different and it’s not for Jisc to prescribe what students need to succeed in different places. However, we know this is an area where a bit of support can really make a difference.
One option is simply to provide a checklist of the information and materials that incoming students find useful. This would relate to the systems you have in use, devices that can be used on the network (and how to connect them), your local learning and teaching practices with technology, and how students can best prepare to study digitally. You could use this to ensure your pre-arrival resources are up to scratch.
Another option is to provide a template (perhaps web based?) into which this information could be embedded.
Either way, your tracker findings could allow you to offer the ‘voice of current students’. For example you could include:
- common digital learning activities, e.g. online research, online discussion, using polling devices in lectures
- how current students find digital learning to be of benefit, e.g. making them more independent in their study habits
- what digital apps and resources might be useful, based on free text responses
- assistive and adaptive technologies other students find useful, again based on free text responses
- helpful quotes from current students – perhaps from free-text responses or focus groups.
Your feedback
We need your feedback on these resources and ideas. You are welcome to use the Jiscmail list for any comments. We will also be launching an evaluation survey (on 4th June) to find out about the experience of running the tracker. This will include questions about the resources we have produced, or might produce, to support you in analysing, reporting and responding to tracker findings.
Please do tell us your views – your input drives the decisions we make and the direction the tracker project goes next.
